
The answer to this complex question is simpler than you might think.

Do you think a business can charge whatever price it wants, to get the highest possible profit? But consumers who demand those products would like to buy them at the cheapest price, so how do they come to a consensus? In markets that are highly competitive (see footnote)*, meaning there are many producers and consumers of a specific good or service, the price of that product or service gets determined by the interaction of supply and demand forces. These forces work together in the same manner as the blades of the scissors cutting the paper.
Wait, but what are these supply and demand forces?
First, let’s understand them individually, and later we will see how they interact to set the “right” price.
Demand
In economics, we assume that people buy more of something when its price is lower. This negative or inverse relationship between price and quantity demanded is called the law of demand. This means the higher the price, the lower the demand is, and the lower the price, the higher the demand is for any normal good or service. Undeniably, a change in people’s tastes, income, and preferences can affect the demand for something, but we will assume that these other factors don’t change, so we can only focus on the relationship between price and quantity demanded.
Let me explain this with a simple example of the demand for bread. The prices are shown on the Y-axis and the quantity that people are demanding is on the X-axis. You can see this inverse relationship in the graph below that slopes downward.
If the price of one loaf of bread is $10 there is going to be very less demand for it, let’s say only 10 loaves of bread will be demanded. Once the price is lowered to $6, a few more people will be willing to buy it, so the quantity demanded increases to 20. And if the price is further lowered to $2, more people would be willing to buy it, as more can afford it, so the quantity demanded now is 40.

Supply
Now let’s look at the supply pattern. For a producer, if he gets a higher price for bread, he will be willing to make more bread and supply more of it. A higher price or reward encourages producers to supply more, and you can see this positive relation in the graph below as an upward-sloping supply curve. So, the law of supply states that there is a positive relationship between the price of a good and quantity supplied. This means the higher the price, the more businesses or producers are willing to supply, and the lower the price, the less they would like to supply. In the graph below, we can see at $2, producers are only willing to supply 10 loaves of bread, at $4, 20 loaves, and at $10, 40 loaves of bread will be supplied.

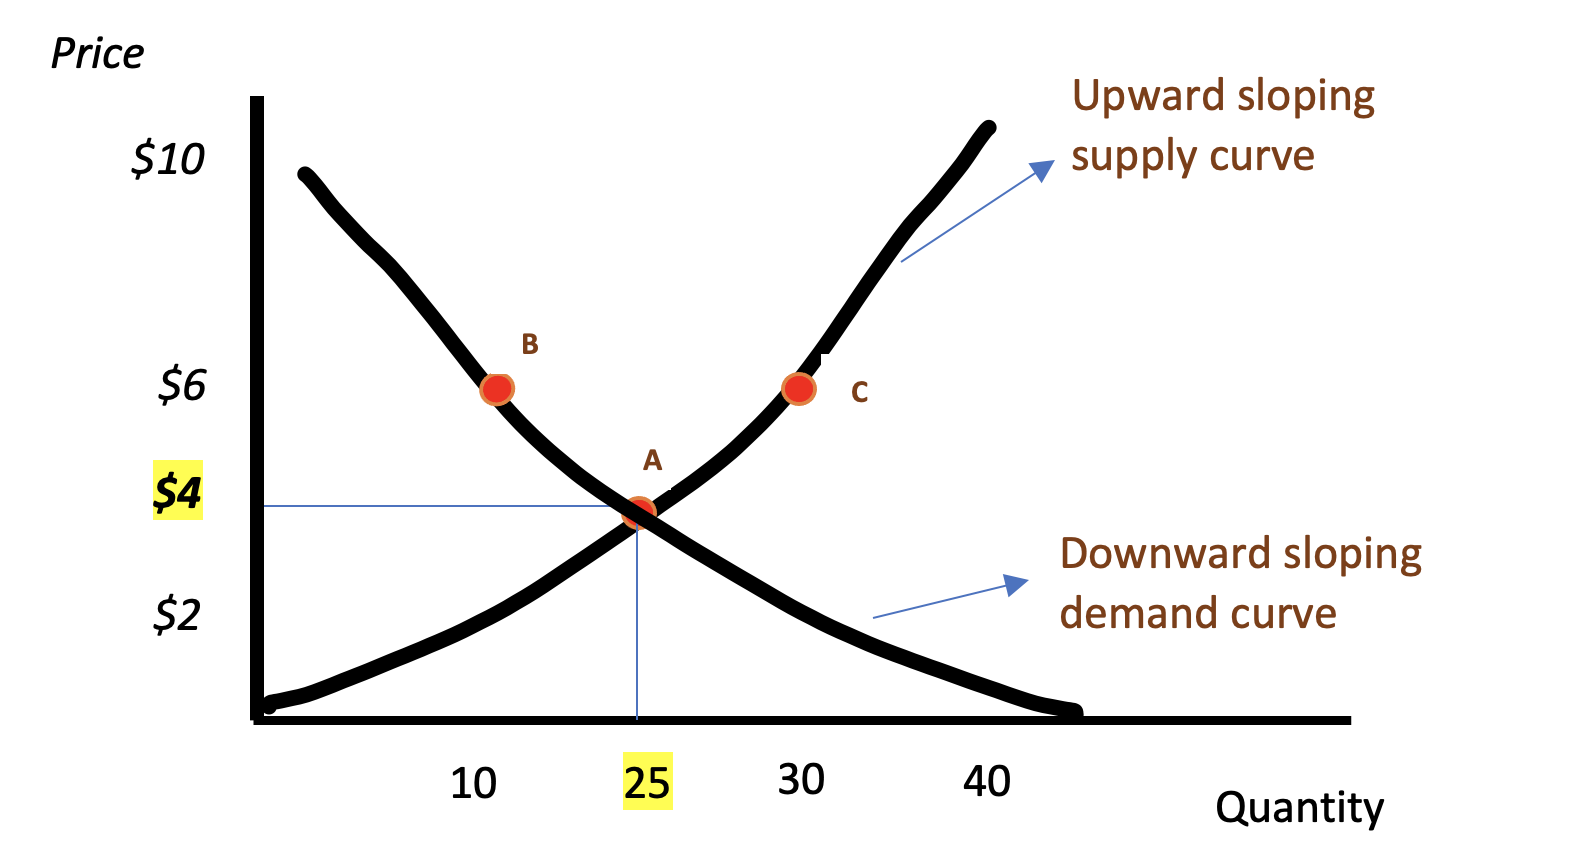
Now when we plot both of them together in one graph, we will see there is one price, where both these curves meet. In economics, we call it an equilibrium point, where the price is just right for the producer/seller and the consumers. In the graph below, this happens at point A, where demand and supply meet or cross each other. The price is set at $4 and the quantity demanded and supplied is 25 loaves of bread. Thus, we saw no one individually impacted the price, but producers’ supply and consumers’ demand worked together to set the price that makes everybody happy.

You understood how prices can influence how much people want to buy and produce. Now, let’s understand also, how it works the other way round, meaning how much people demand and businesses supply can influence the prices as well.
If there’s more demand than supply for something (such as point B above), this will send a signal to the producers to increase the price from $2 to $6, because they understand that people are prepared to pay more to receive that good or service. In this case, there is an incentive for the producers to increase the price. If the price goes up to $6, some consumers will drop out as they won’t be able to afford bread at price $6.
On the other hand, if there is more supply than demand (shown as point C above), this is a signal to the producers to lower the price from $6 to $2, because the price at $6 was too high and there is a very limited number of people who are willing to buy it. Now some producers, might drop out and can’t lower the price to $2, because they can’t cover their cost of production.
Over time the price will keep moving upwards or downwards until it reaches a point where demand is equal to the supply, at point A ($4).
Today, you learned two fundamental concepts in economics: the law of demand and the law of supply.
If you are wondering about whether it is possible to plot these demand and supply curves in real life, the answer is, yes? In economics, a graph is just a simple representation of economic principles or behavior observed. Economists survey people and collect data and plot that data using easy-to-understand graphs. In the demand and supply curves we looked at today, the slope could be steeper or flatter. In order to learn what decides how steep or flat (demand or supply) curve will be, we will have to look into another important principle in economics called elasticity. More on that will be in my future posts. For now, if you just want to know why economists use models and graphs to solve real-world economic problems, please read my post here.
*In non-competitive markets, like monopolies, where one company controls the market, it gets more control in setting the price. The demand and supply forces don’t work very well here. Producers want to get the maximum profits by setting the price higher and can do that as well. In the absence of other competing businesses, consumers who want to buy their product or use their service, don’t get other options. Hence, they end up paying a higher price than they would have paid if more companies were in the market for that product or service. Usually, to prevent businesses from exploiting consumers, some government intervention is required so these monopolies don’t create artificial barriers to entry.
It is worth noting that, some monopolies can happen naturally and not all monopolies are bad. We will look at this more in detail with real-world examples in another post.